

|
Available diagram types |
List
|
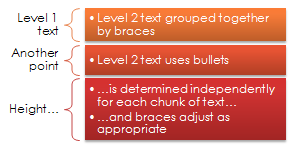
Vertical Bracket List Use to show grouped blocks of information. Works well with large amounts of Level 2 text. | |
|
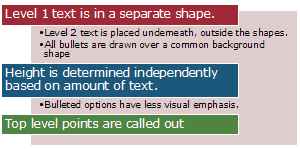
Vertical Header List Use for grouping information. Works well with large and differing amounts of text, as each shape grows independently. | |

|
Numbered List Use for numbering or lettering a sequence. Level 1 text should be a short number or letter. Works well with large amounts of Level 2 text. | |

|
List Dots Use for displaying an ordered sequence. Good for smaller amounts of text or shorter lists. The height of each shape is independently determined based on its text. | |
|
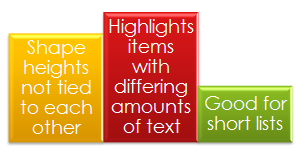
Bar List Use for emphasizing items of different weights. Good for smaller amounts of text or shorter lists. The height of each shape is independently determined based on its text. | |

|
Varying Width List Use for emphasizing items of different weights. Good for large amounts of Level 1 text. The width of each shape is independently determined based on its text. | |

|
Varying Text List Use to stylistically emphasize different amounts of text. Text size varies between shapes. | |

|
Word Snake Use for emphasizing each word, phrase or sentence in a paragraph. Works well when each piece of text varies in length. |
Process

|
Vertical Process Pair Use to show a progression or sequential steps in a task, process, or workflow from top to bottom. Works well with large amounts of Level 2 text. | |

|
Log Cabin Spiral Use to represent a converging process. Works best with a small amount of text. |
Hierarchy

|
2 Level Hierarchy Use to show hierarchical relationships progressing from top to bottom. Good when you want to emphasize two levels of the hierarchy. Supports Organization Chart options for changing layout. | |

|
3 Level Hierarchy Use to show hierarchical relationships progressing from top to bottom. Good when you want to emphasize three levels of the hierarchy. Supports Organization Chart options for changing layout. |
Relationship

|
Tabbed Arc Use to show a set of related items arcing over a common area. Best with small amounts of text. |
Calendar

|
Simple Calendar Use for showing a simple calendar of events. Level 1 text is the date and Level 2 text represents the associated event. | |

|
Calendar Dots Use for showing a simple calendar of events, with emphasis on the date. Level 1 text is the date and Level 2 text represents the associated event. | |

|
Calendar with Triangles Use for showing a simple calendar of events, with emphasis on the date. Level 1 text is the date and Level 2 text represents the associated event. |

This work is licensed under a Creative Commons Attribution 2.5 License.
These diagram files (GLOX) can be freely used and modified.
If the GLOX is modified and redistributed, please include an attribution to the author, Scott Sherman.
